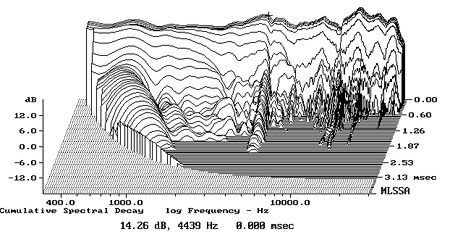
this is because the CMT-340 has higher sensitivity. The dB scale is absolute SPL, normalized to a reference level. The highest point of the dB range on the Y-axis is -6dB, (for the 340 graph) and this is approximately what the normalized absolute SPL level of the fundamental slice measured. The highest point of the dB range (y-axis) on the 170 measurement is -12dB and this is approximately what the normalized absolute SPL measured. Notice too on the CBM-170 graph that the 0ms slice appears slightly higher on the graph than the CMT-340.. This is because the absolute measurement should really be a dB or 2 higher than -12dB.. It is difficult to visualize dB levels, and this is because the dB level is not important. From that normalized absolute SPL level, the range is then generated in 6dB increments. CMT-340 = -6dB to -42dB. CBM-170 = -12dB to -48dB..